Cambridge® Home
Cambridge® Home
eCommerce Case Study


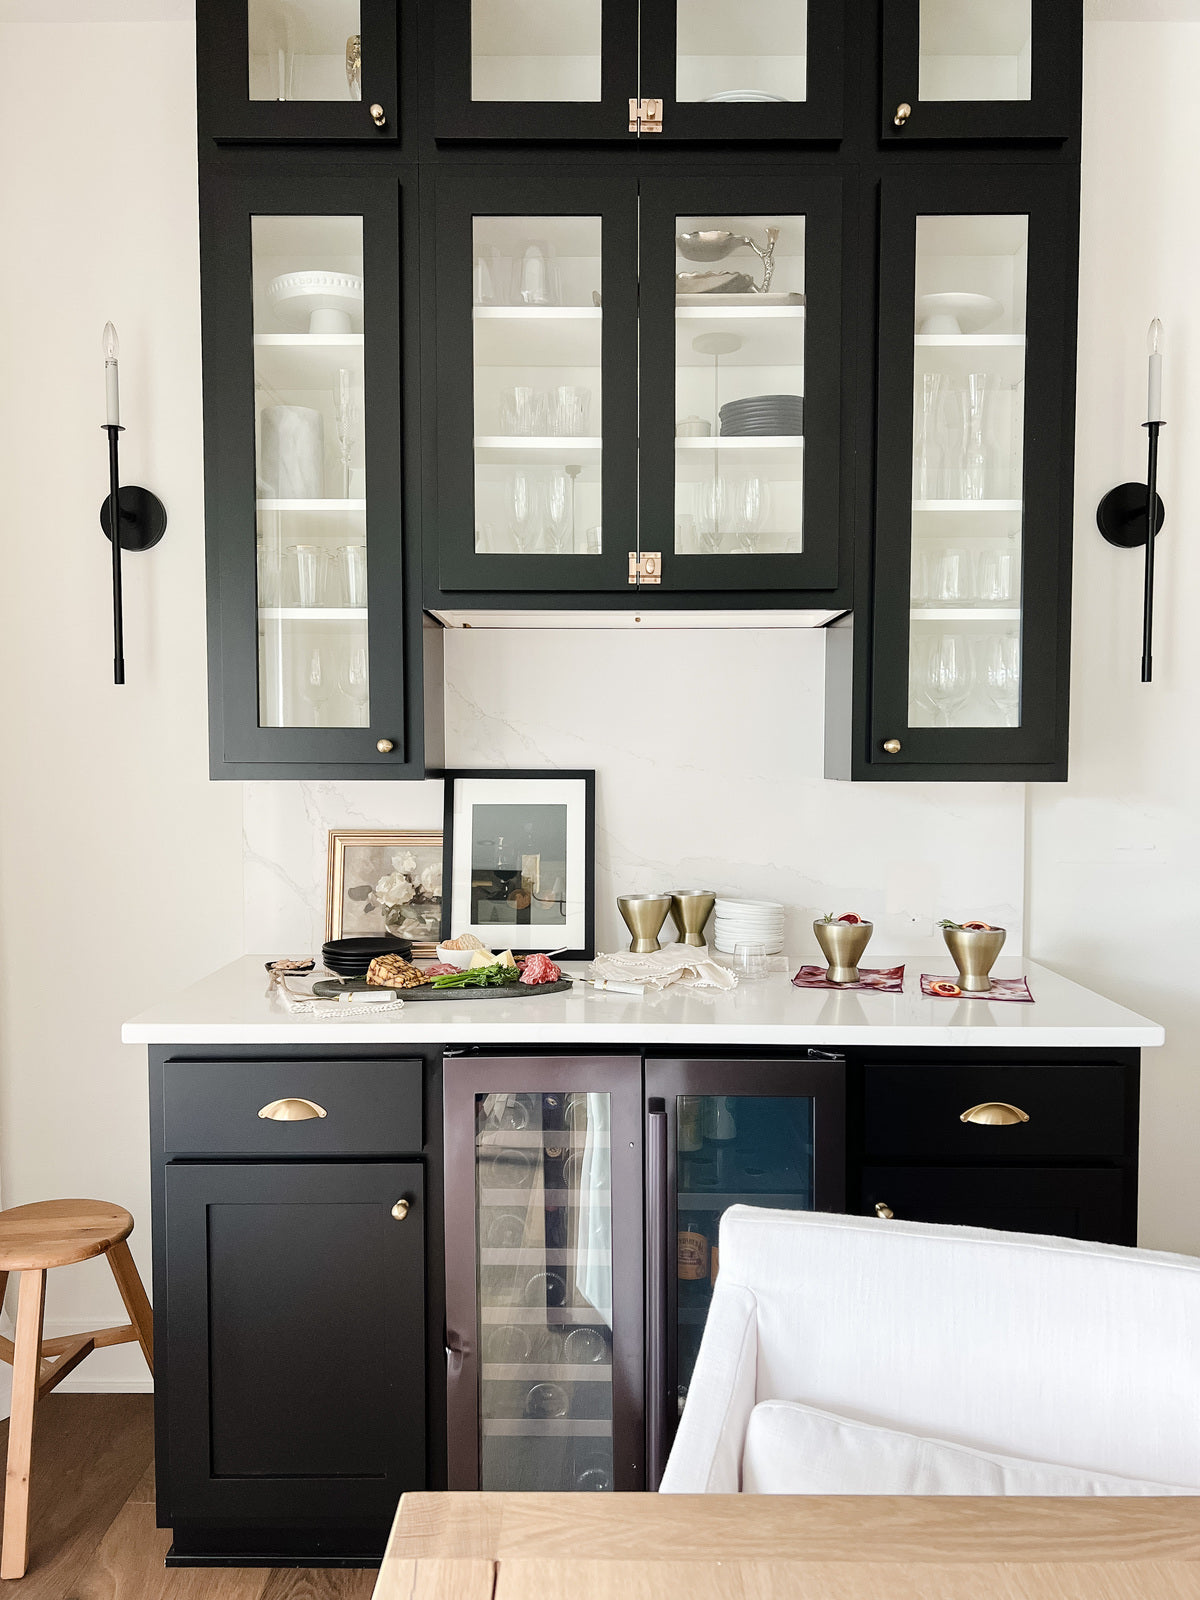
Cambridge® is a family-run business for three generations now dedicated to perfecting the art of exceptional style, quality, and value in home and tabletop accessories. They’re an industry leader in design and innovation for serveware, stemware, and other tabletop accessories. While offering design-forward products with innovative styles and finishes, Cambridge® is also known for providing high-quality products at accessible prices. They believe that stylish home accessories can be an affordable luxury for everyone.

Our strategists at CAKE were in for a sweet treat when Cambridge® home came to us looking to improve their brand strategies. Cambridge® initially started as a wholesaler, where consumers could only find their products in stores such as Kohl’s, Walmart, and Wayfair. The main challenge was communicating to consumers that Cambridge® was now available direct for the first time in company history.
Cambridge® needed to redefine its brand within this market. Their recognizable name of Cambridge® Silversmiths was moving to Cambridge® home – allowing the brand to highlight its exclusive collections and expansion beyond flatware into home categories like serveware, barware, coasters, and other entertaining essentials.
The first (and obvious) ingredient we thought to add on the paid media side was a multi-channel effort focusing on two main layers of the marketing funnel. We leveraged paid social channels (Facebook, Instagram, Pinterest, and YouTube) to reach unexposed audiences who would be interested in the Cambridge® products. In addition, we created a paid search campaign to capture the already existing demand from the wholesale side to convert these potential consumers to the direct site.
Within the first 90 days, these campaigns had extreme reach: Facebook and Instagram had a unique reach of 910,968 with a daily reach of ~10,100 people. Pinterest had a unique daily reach of ~3,500 people, while YouTube had a unique daily reach of ~4,300 people. What’s sweet about these results is that each platform had a low cost per reach.
Another part of our recipe included paid search ads, where we focused campaigns on branded terms only. Because there was already a high search volume for the Cambridge® brand, consumers were already searching and shopping via retailers. To improve things, we added Cambridge®’s DTC site into the already existing SERPs for Cambridge® products, allowing us to tap into existing demand and stand out from retailers with “Now Available Online Direct” messaging.
These campaigns exceeded expectations from the jump, as we ended up with a 30% click share on our campaigns in the first 90 days. One in every three paid clicks was on Cambridge®’s DTC site – which significantly disrupted the retailer campaigns. The campaigns averaged 100 clicks a day and boosted the DTC site’s visibility, as paid search made up 35% of site traffic.
Paid search also had a significant impact on helping the brand see revenue success in the first 90 days, as it directly drove 71% of all revenue seen during that period.
Now for the job of our SEO strategists – they focused on delivering quality tag work throughout the site. By generating optimized tags through keyword research and search trends, we were able to bring substantial increases in the number of keywords and other important metrics. We also increased on-page optimization in the form of blogs and gift guides and accommodated the seasons and holidays that would follow.

Your Next Customers Haven’t Searched Yet
If your growth depends only on Google and Meta…you’re competing for the same customers as everyone else. Let’s change that.
